How Much Do Movies Make?
Introduction
How movies perform in the box office tends to generate a lot media buzz and public discussion. In some cases, box office performance influences our attitude towards a movie. We often ask ourselves how can a critically acclaimed movie become such a box office flop (The Shawshank Redemption) or how can a terrible movie become such a box office success (Paul Blart: Mall Cop). Are we the ones that are crazy to think that everyone should watch Children of Men or, are we pretentious to think that Armageddon was terrible. Surely with $550 in box office revenue, the 100s of millions of people that watched Armageddon cant be wrong. While there is much heated debate on what makes a movie a work of art or what makes it crap, the economics of the situation are clear. People will vote with their wallet and companies in the movie industry (production companies, distributors, theater, etc..) are only looking out for their bottom line. As such it is in the companies’ best interests to produce, distribute and show movies that will generate the most money in the box office for the lowest cost. 1
Good or bad, the only performance metric we will consider is how much a movie makes in the box office relative to how much it costs. Intuitively, one would expect that there is a causal relation between the two, that is, on average, the more money is invested into a movie the more money it will make in the box office. Of course we can’t expect to have a simple and accurate formula that will determine the relation between the two as there are many factors that contribute to a movies success (advertising, release date, number of showings, etc…). However, with the data we have at our disposal from BoxOfficeMojo, we can use statistical methods to determine how causal the relationship is and just how profitable movies are. Let’s begin by plotting the budget of a movie against how much it makes globally in the box office.
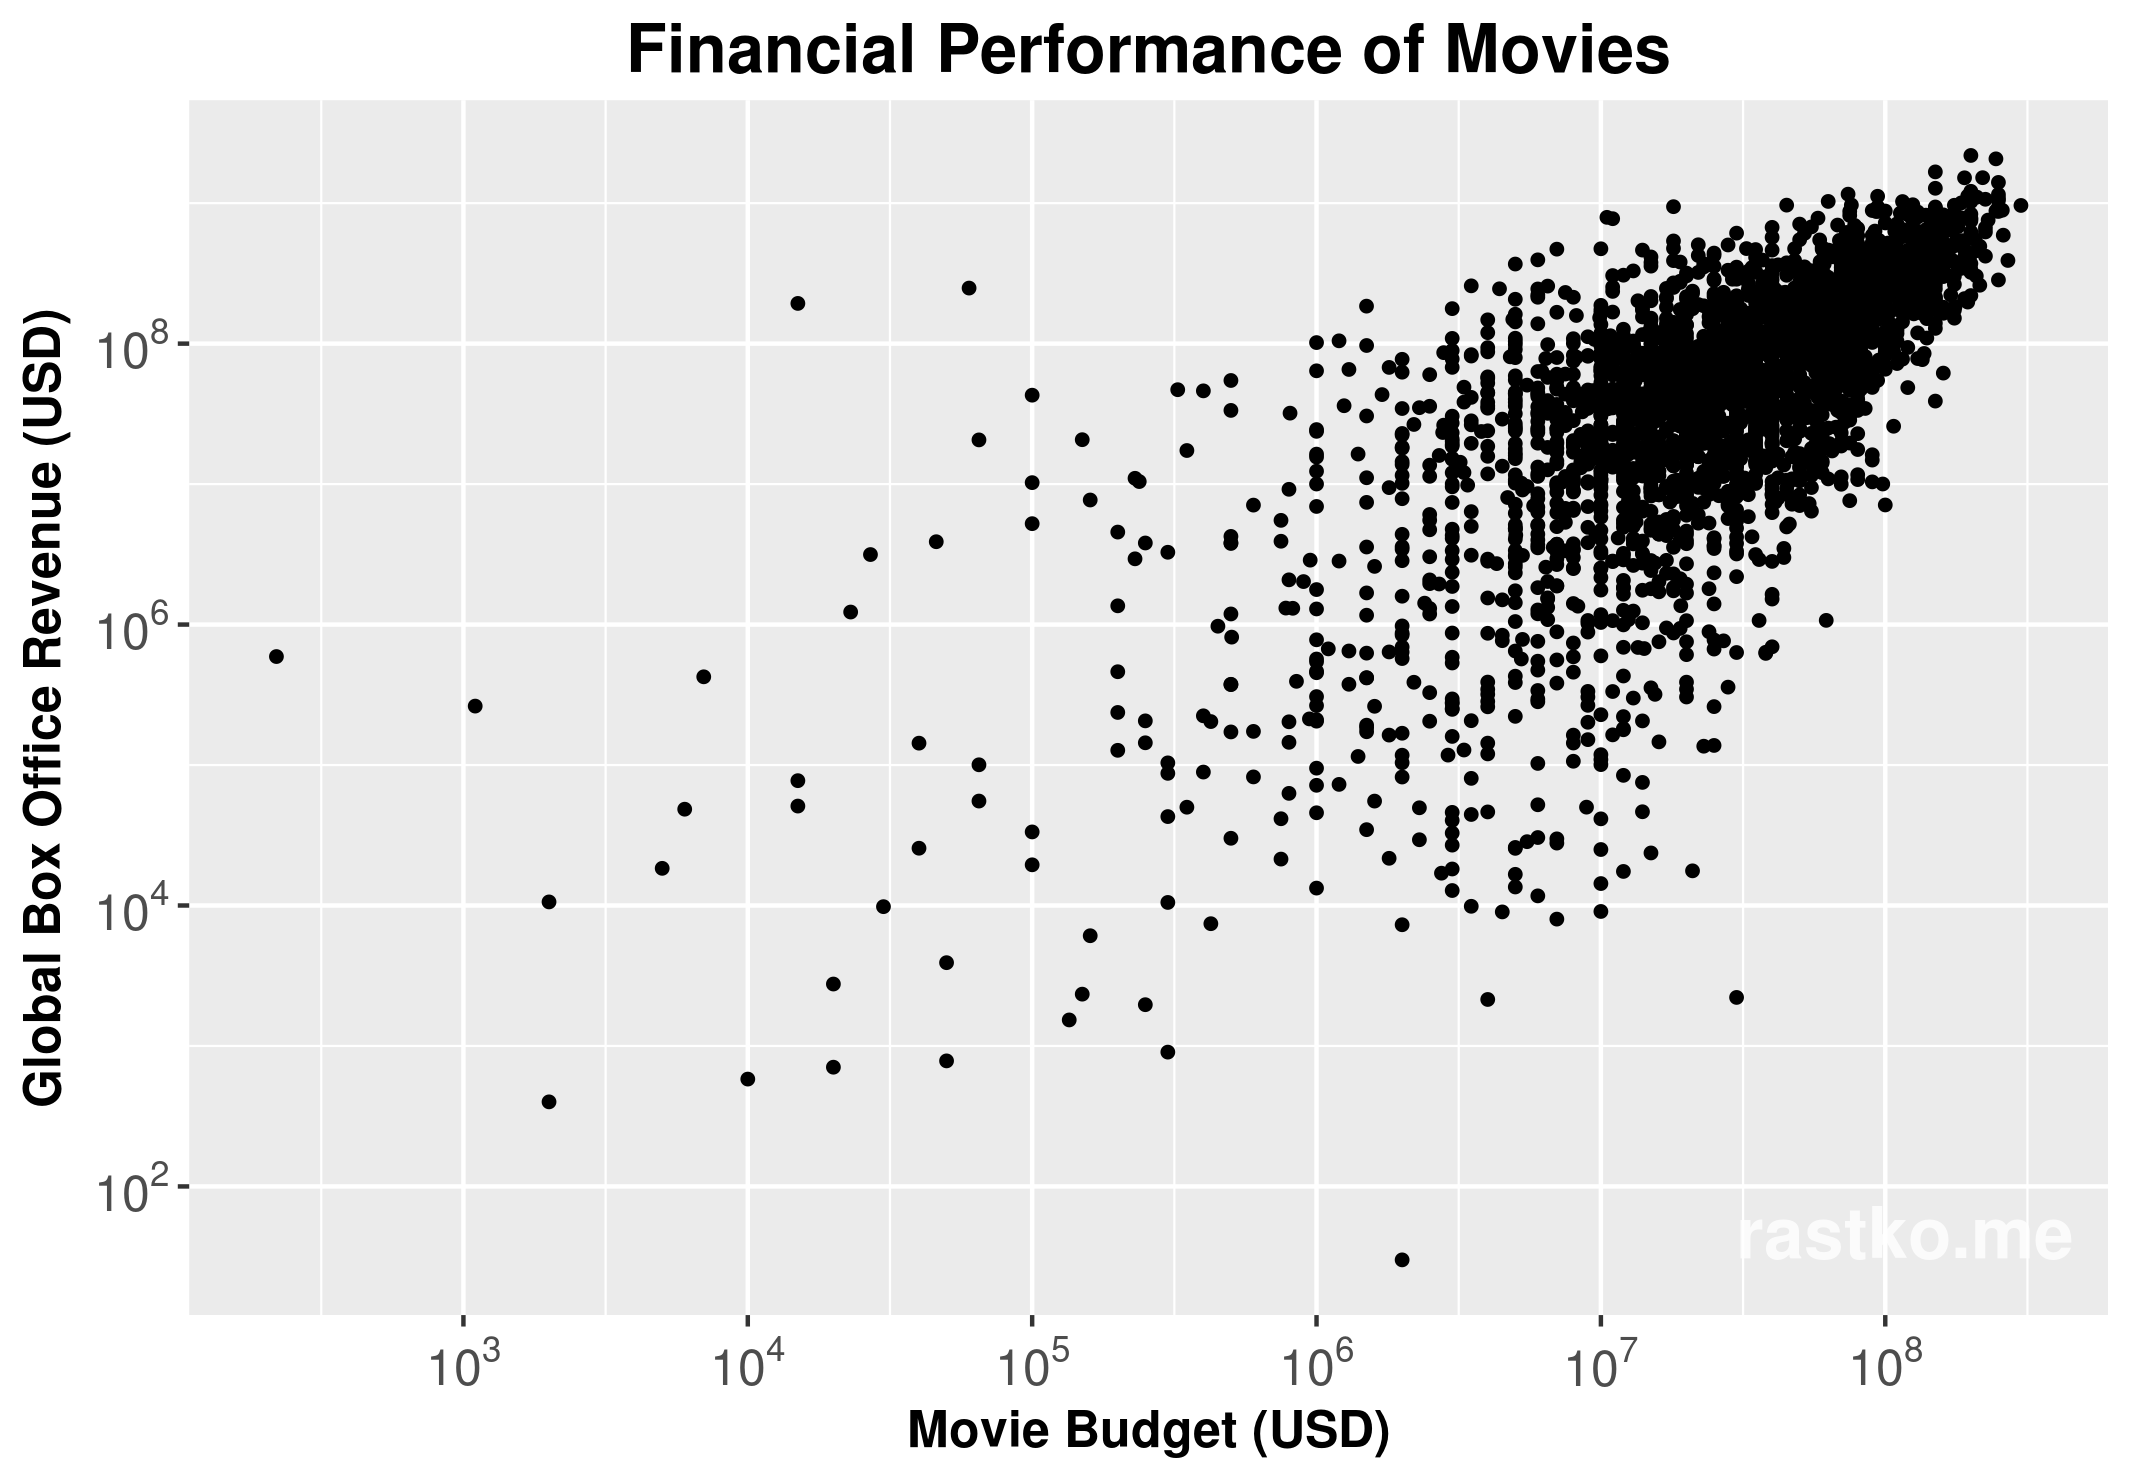
A scatter plot of movies' box office revenues relative to its budget. A total of N=3042 points were used. No correction for inflation has been made to this data
Data
A couple of things are glaringly obvious just by looking at the graph above:
- The data indicates that there exists, on average, a linear trend between budget and box office revenue.
- The variance of the box office revenue relative to its budget is large, which means that any linear fit will give us a large mean squared error (MSE).
- The variance is a lot larger for movies with lower budgets and it decreases for movies with higher budgets.
- Movie budget data tends to have low fidelity with many movie budgets rounded up or down to nearest order of magnitude.
The data was obtained from BoxOfficeMojo around the start of December 2016. From the data, 3042 of a total of 16809 movies had both movie budget as well as box office revenue information. This represents less than a 1% sample of all the feature films (365,697 as of writing this) contained on IMDB2. Ideally my data set, while not large, would represent an unbiased and randomly selected collection of movies. However I do admit that this is not the case and that the data does contain some bias. The sources of bias are:
- Major motion pictures with a wide release and big production companies are overly represented.
- Movies that have been released within the last two decades are also overly represented.
- Low budget films are under represented, but this may have more do with 1. as movie budget and the size of the release are correlated.
- Budget data it self isn’t that reliable and the website is fairly opaque as to its sources.
Currently I don’t have the time or the data at my disposal to be able to get rid of all the biases and re-weight the data. As such the the biases will persist within the analysis. The most pernicious bias is the accuracy of the movie budget information as it is known to be unreliable. It is well known that production companies have a tendency to distort movie budgets through a practice known as Hollywood accounting, whereby they inflate or deflate the budget numbers as it suits them. The whole industry is rife with secrecy about their movie budgets that there is a special term for it 3. Unfortunately there is not much we can do about the accuracy of the budget data and, for what its worth, we will have to take it at face value.
Mathematical Model
To describe the financial performance of a movie, we will use a monomial model of the form \[ \mathsf{R = cB}^{\alpha} \]
We define to be the global box office revenue of a movie and to be it’s budget, is the profitability ratio and is the power parameter 4. Conveniently, the above monomial model turns into a linear model in log-log space, which we have plotted above. This allows us to use linear regression to determine the parameters and . If there was a purely linear relation between and then we would expect to be (or statistically close to it) and the model would reduce to .
Theatres
Before I continue to the statistical analysis of our movie data I would like to digress a bit and discuss the role of theaters in the movie industry. It is often said that theaters are in the food business, not the movie business. This is primarily because the margins on the theaters concession stands are much higher than the ones on the movies. Most theaters in north America belong to one of the big movie theater chains. Cineplex almost has a monopoly in Canada with approximately 80% market share while in the USA the landscape is more competitive with Regal Entertainment, AMC Entertainment, Cinemark USA, Carmike Cinemas, and National Amusements controlling 45% of the market. Luckily all of these companies are publicly traded and anyone can view their financial statements. From there we can get an estimate of how much money they make on concession vs. how much money they make on movie tickets. Looking at their annual income statement one can see that 50% to 65% of the theaters revenues comes from admissions and around 30% of the revenue comes from food and beverage sales. The rest comes from advertising and other ventures which vary from company to company. However looking at the operational costs we can see that the margins on movie tickets are around 100% where as the margins on food and beverage sales are around 800%. This explains why your theater popcorn and drink are so expensive. More interesting are the contracts that theaters sign with movie distribution companies to show a movie. While on average 50% of what you pay at the box office goes to the theater and the other 50% goes to the distribution company, the actual contracts are negotiated on a movie by movie basis. The contracts themselves have an interesting payment structure. They heavily favour the distributor in the early weeks of the showing, and slowly shift to favouring the theater later on. A typical contract could be something like 90% of box office revenue goes to the distribution company for the first two weeks of a movies release, and after that 90% of the box office revenue goes to the theater. Having access to the terms of these contracts would give a much better picture of how Hollywood operates, as well as how industry executives perceive the success of their movies.
For now, we will use aggregate theater financial data to determine if a movie is profitable. If we will say that the movie is profitable. Given that we don’t know the actual terms and conditions signed between the movie company and the theaters showing the movie, it is entirely possible for a movie to make money and as it is possible for a movie to lose money and . If then the movie is breaking even, and if then the movie is not profitable.
Analysis
Linear Fit of Financial Performance
We can use our data to determine the line of best fit and measure the correlation.
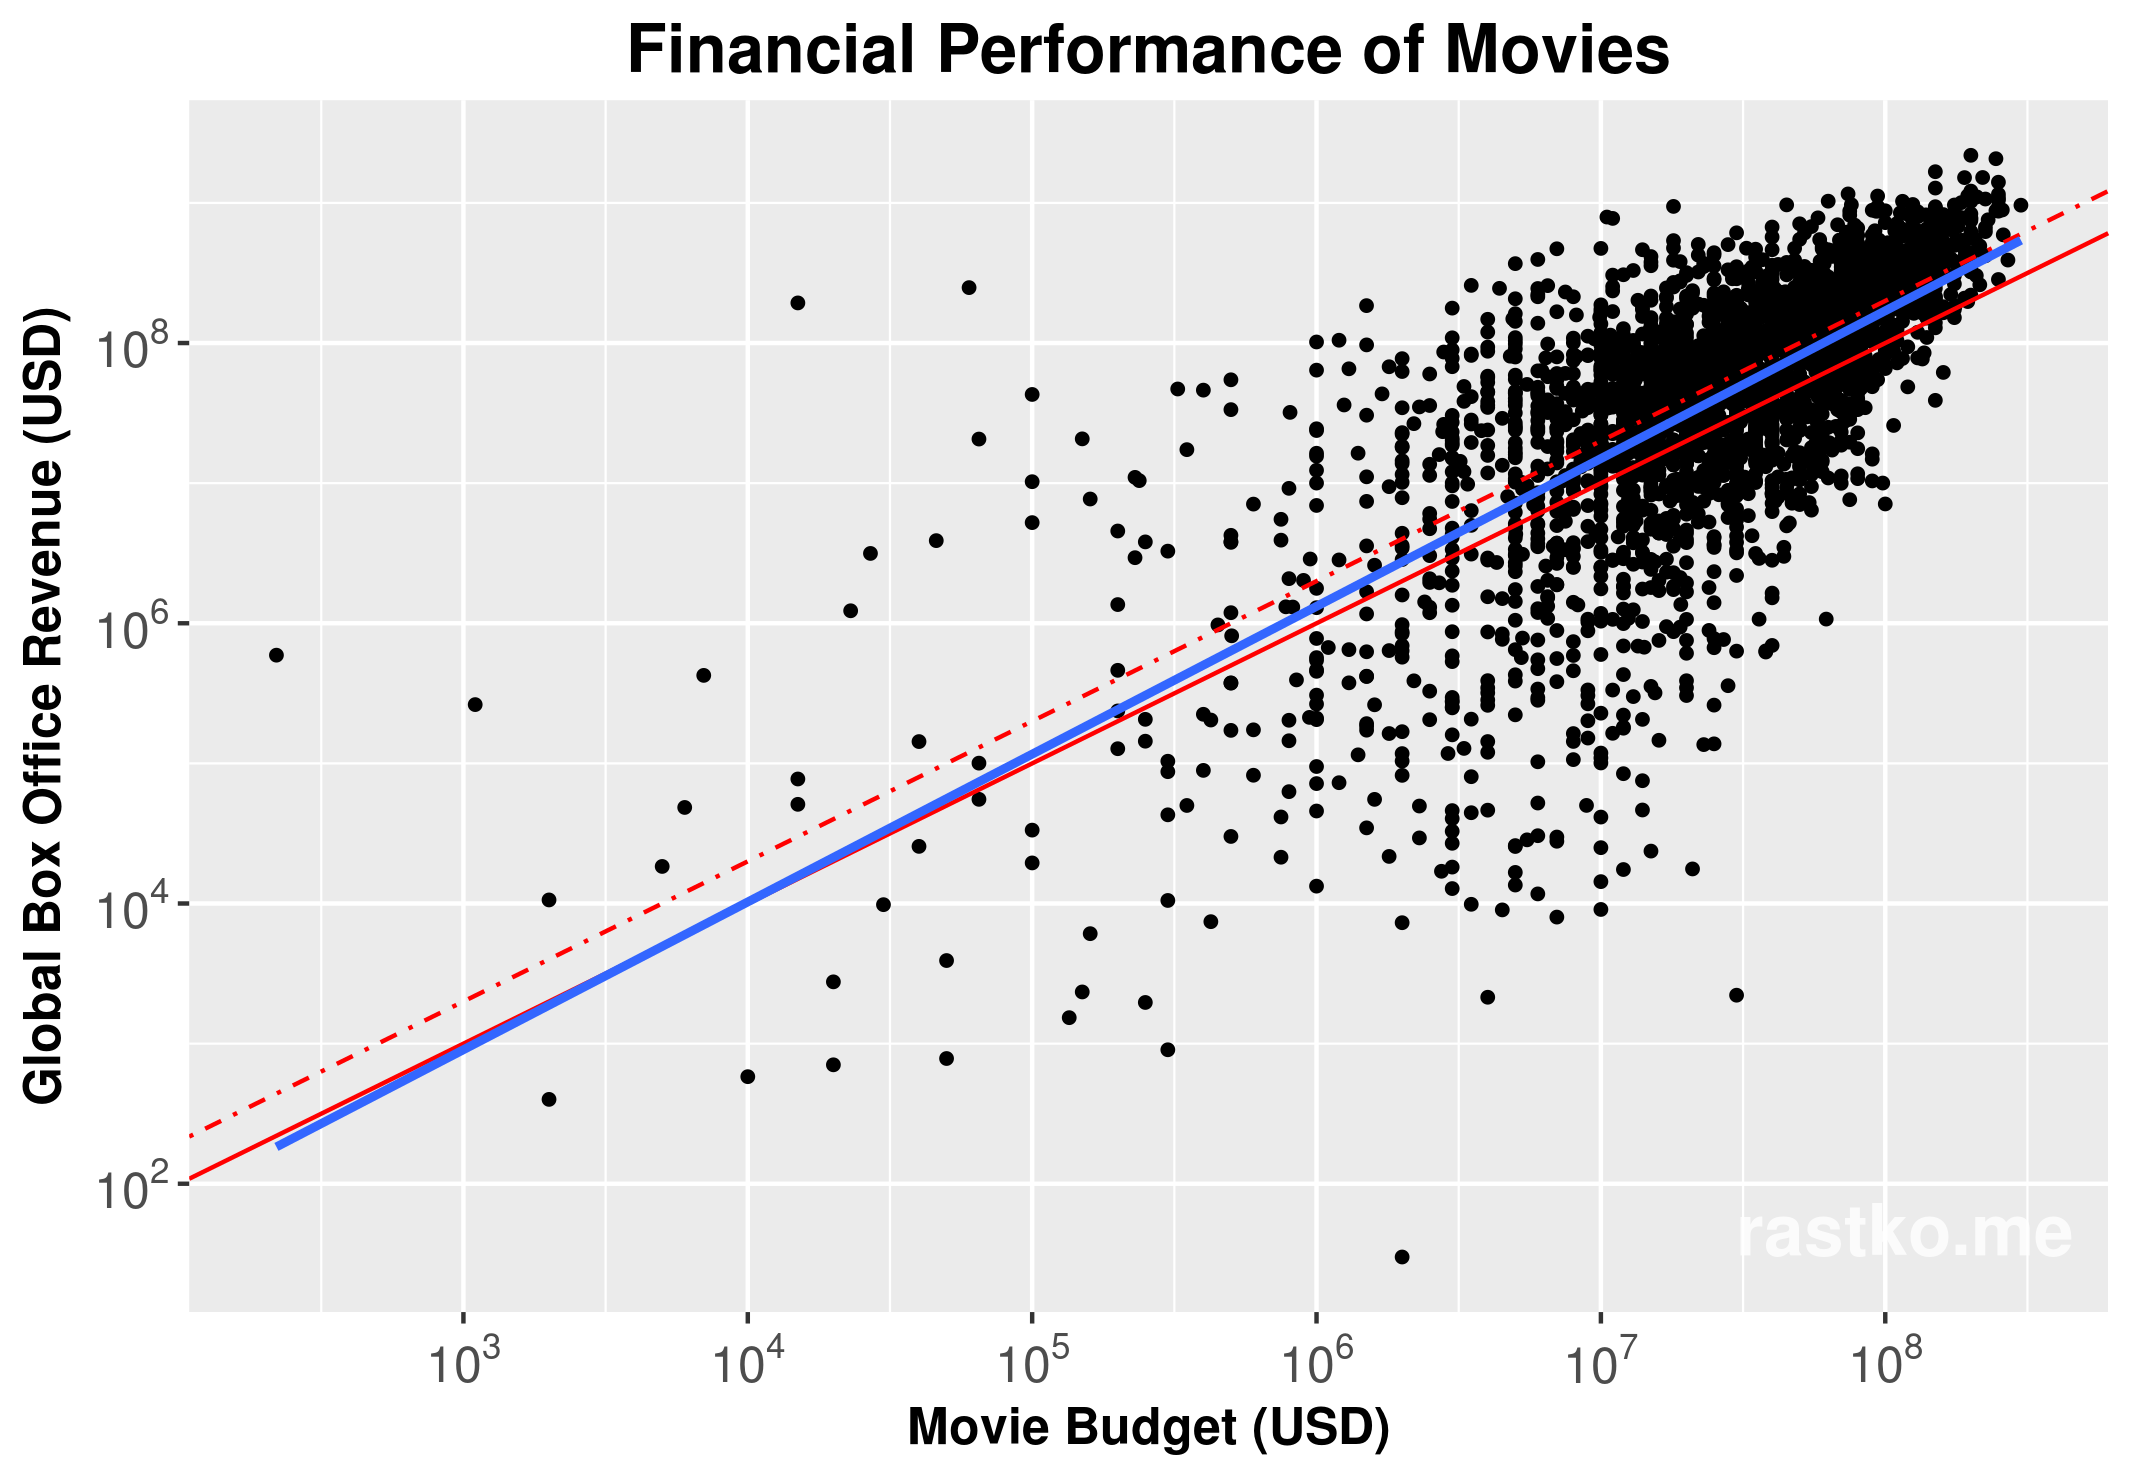
Adding a linear line of best fit (blue) as well as the profitability line (red dotted) and breakeven line (red solid)
Above, we have also plotted the profitability line (red dotted, given by ) and the breakeven line (red solid, given by ) alongside the line of best fit. We can see that our line of best fit goes directly between these two lines and has a slope greater than one. The adjuster R-squared value is 0.4731 and the best estimates for our parameters is given by
| Parameter | Estimate | Std. Error |
|---|---|---|
| -0.20762 | 0.14908 | |
| 1.05475 | 0.02018 |
We can also segment our data based on the the movie budget to see how our model behaves over different budgets. Below I have ranked all the movies based on budget, and placed them in six different bins, resulting in around 500 data points per bin.
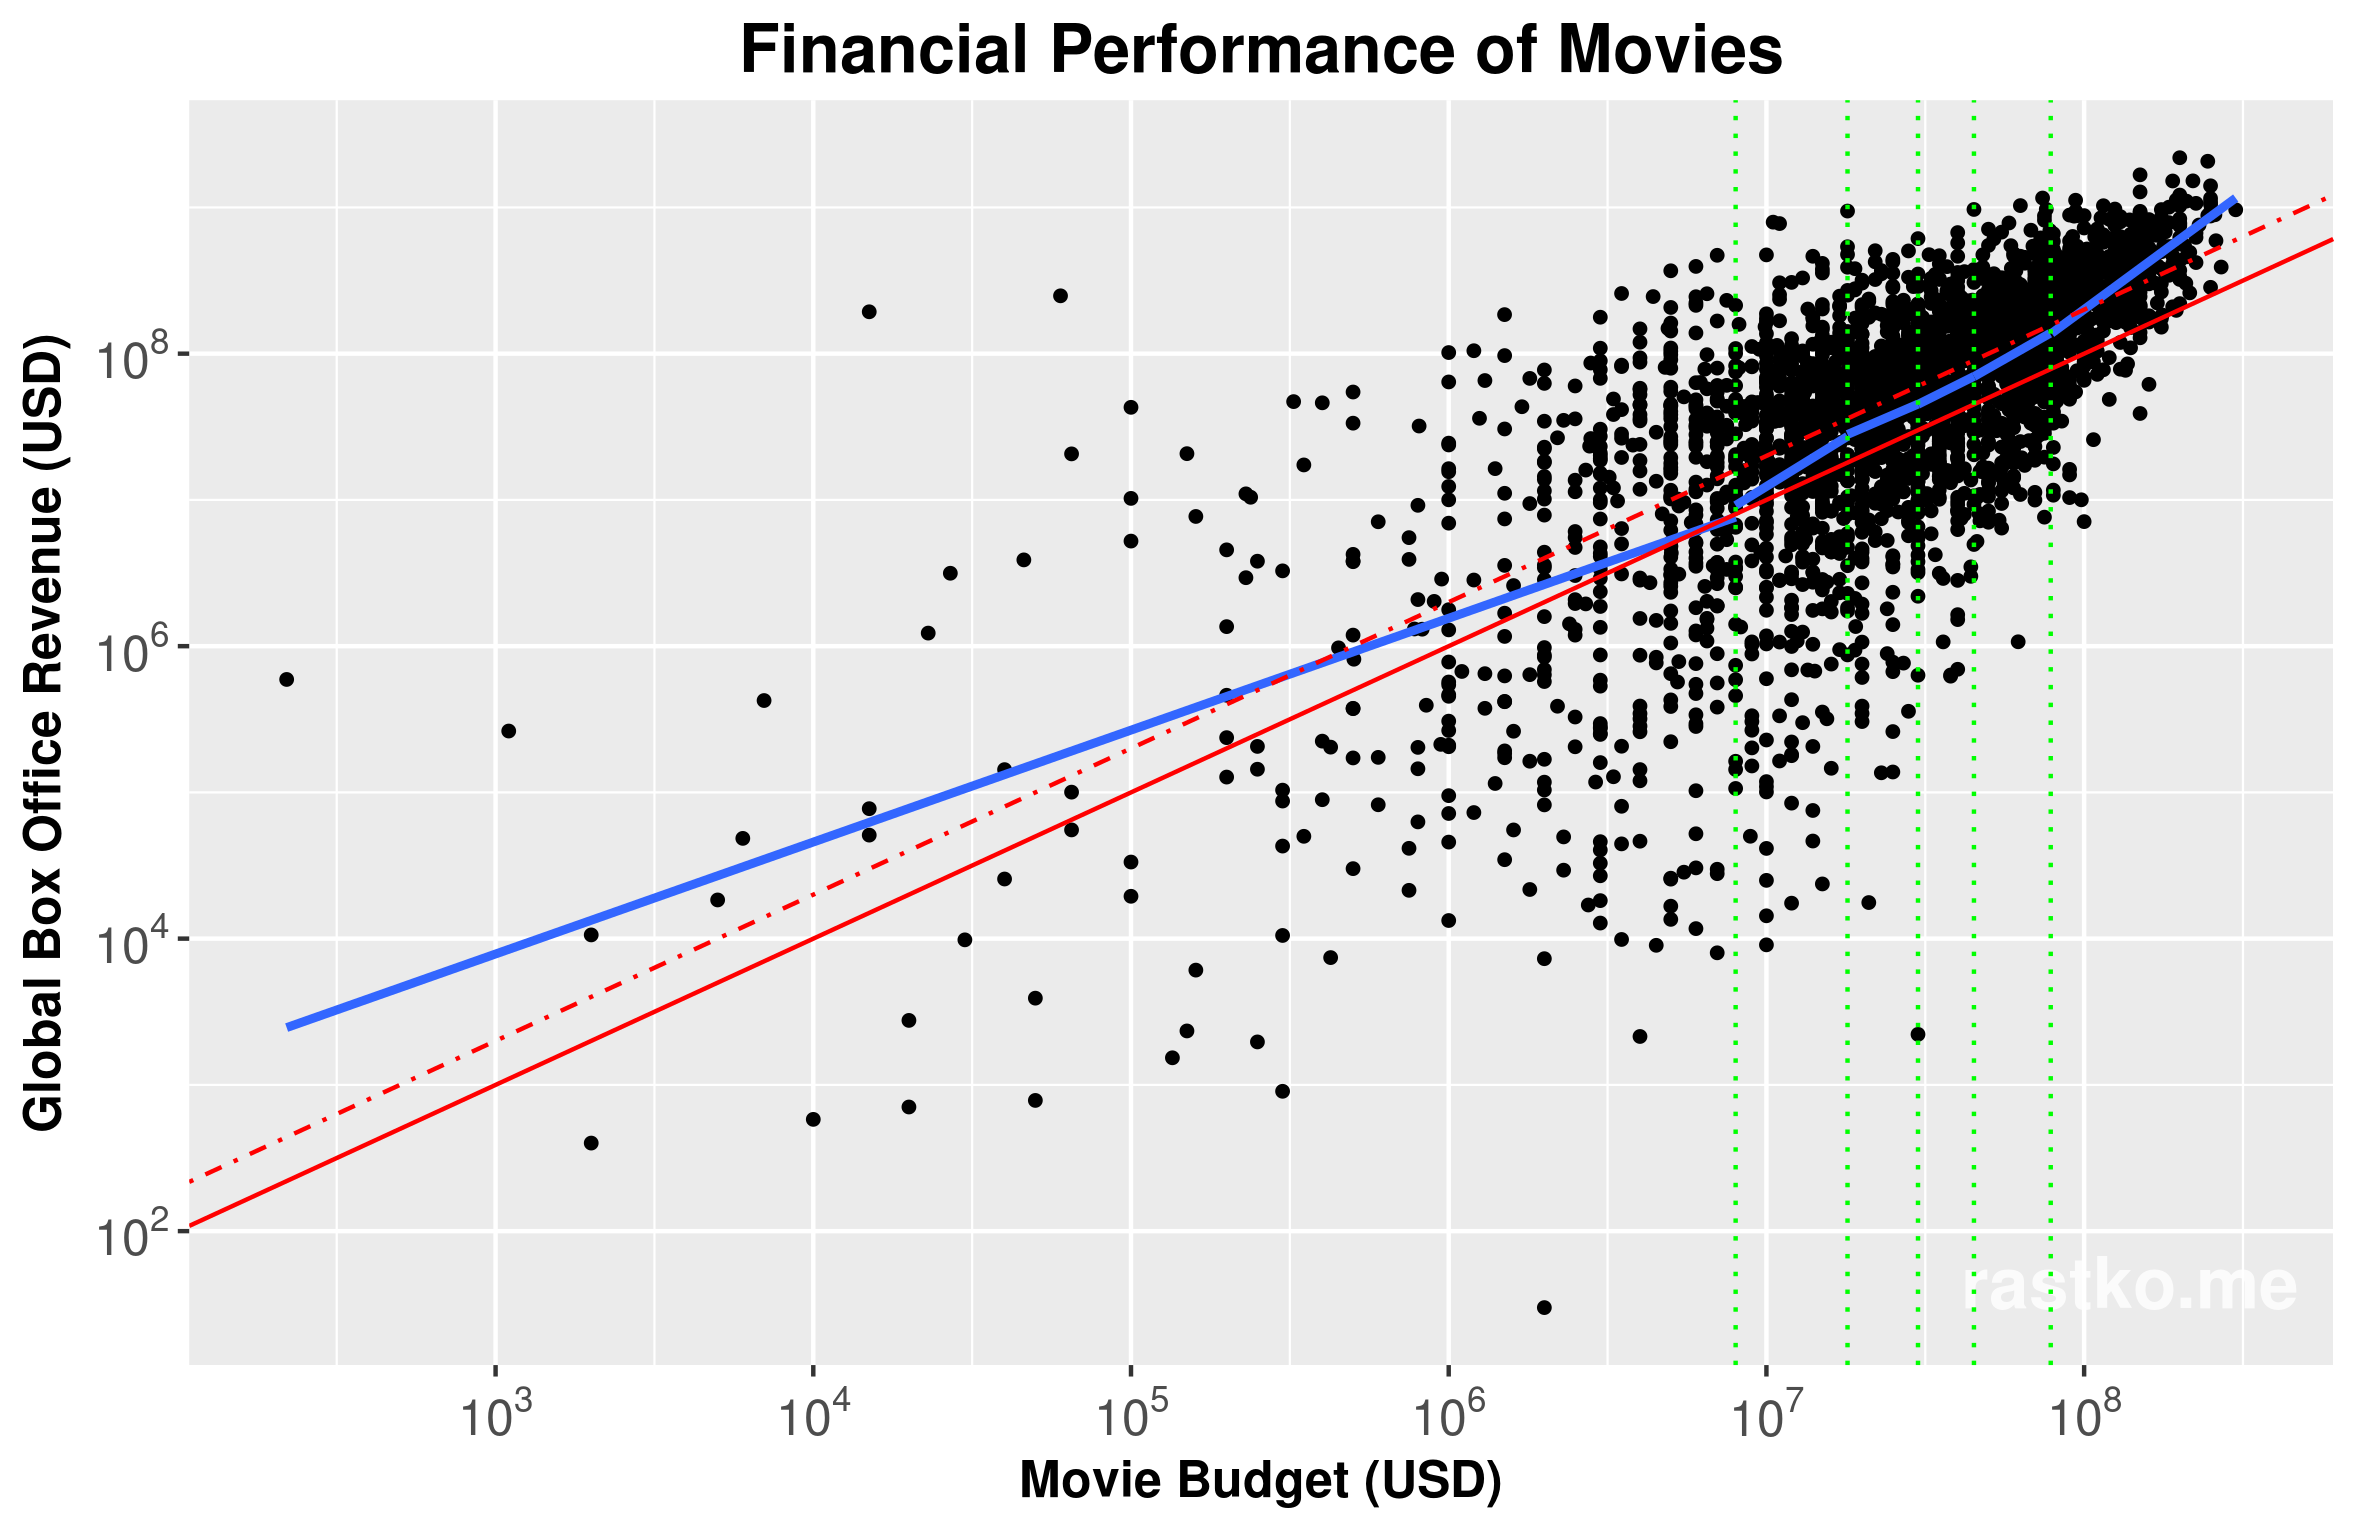
Segmenting the data set into 6 groups based on the budget of a movie. Each segment contains 507 movies. Dotted green lines indicate segment boundaries
Distribution of Financial Performance
Given the data at our disposal, we can also look at the distribution of the movies’ financial performance. This can give us a sense of how good of an investment a movie is.
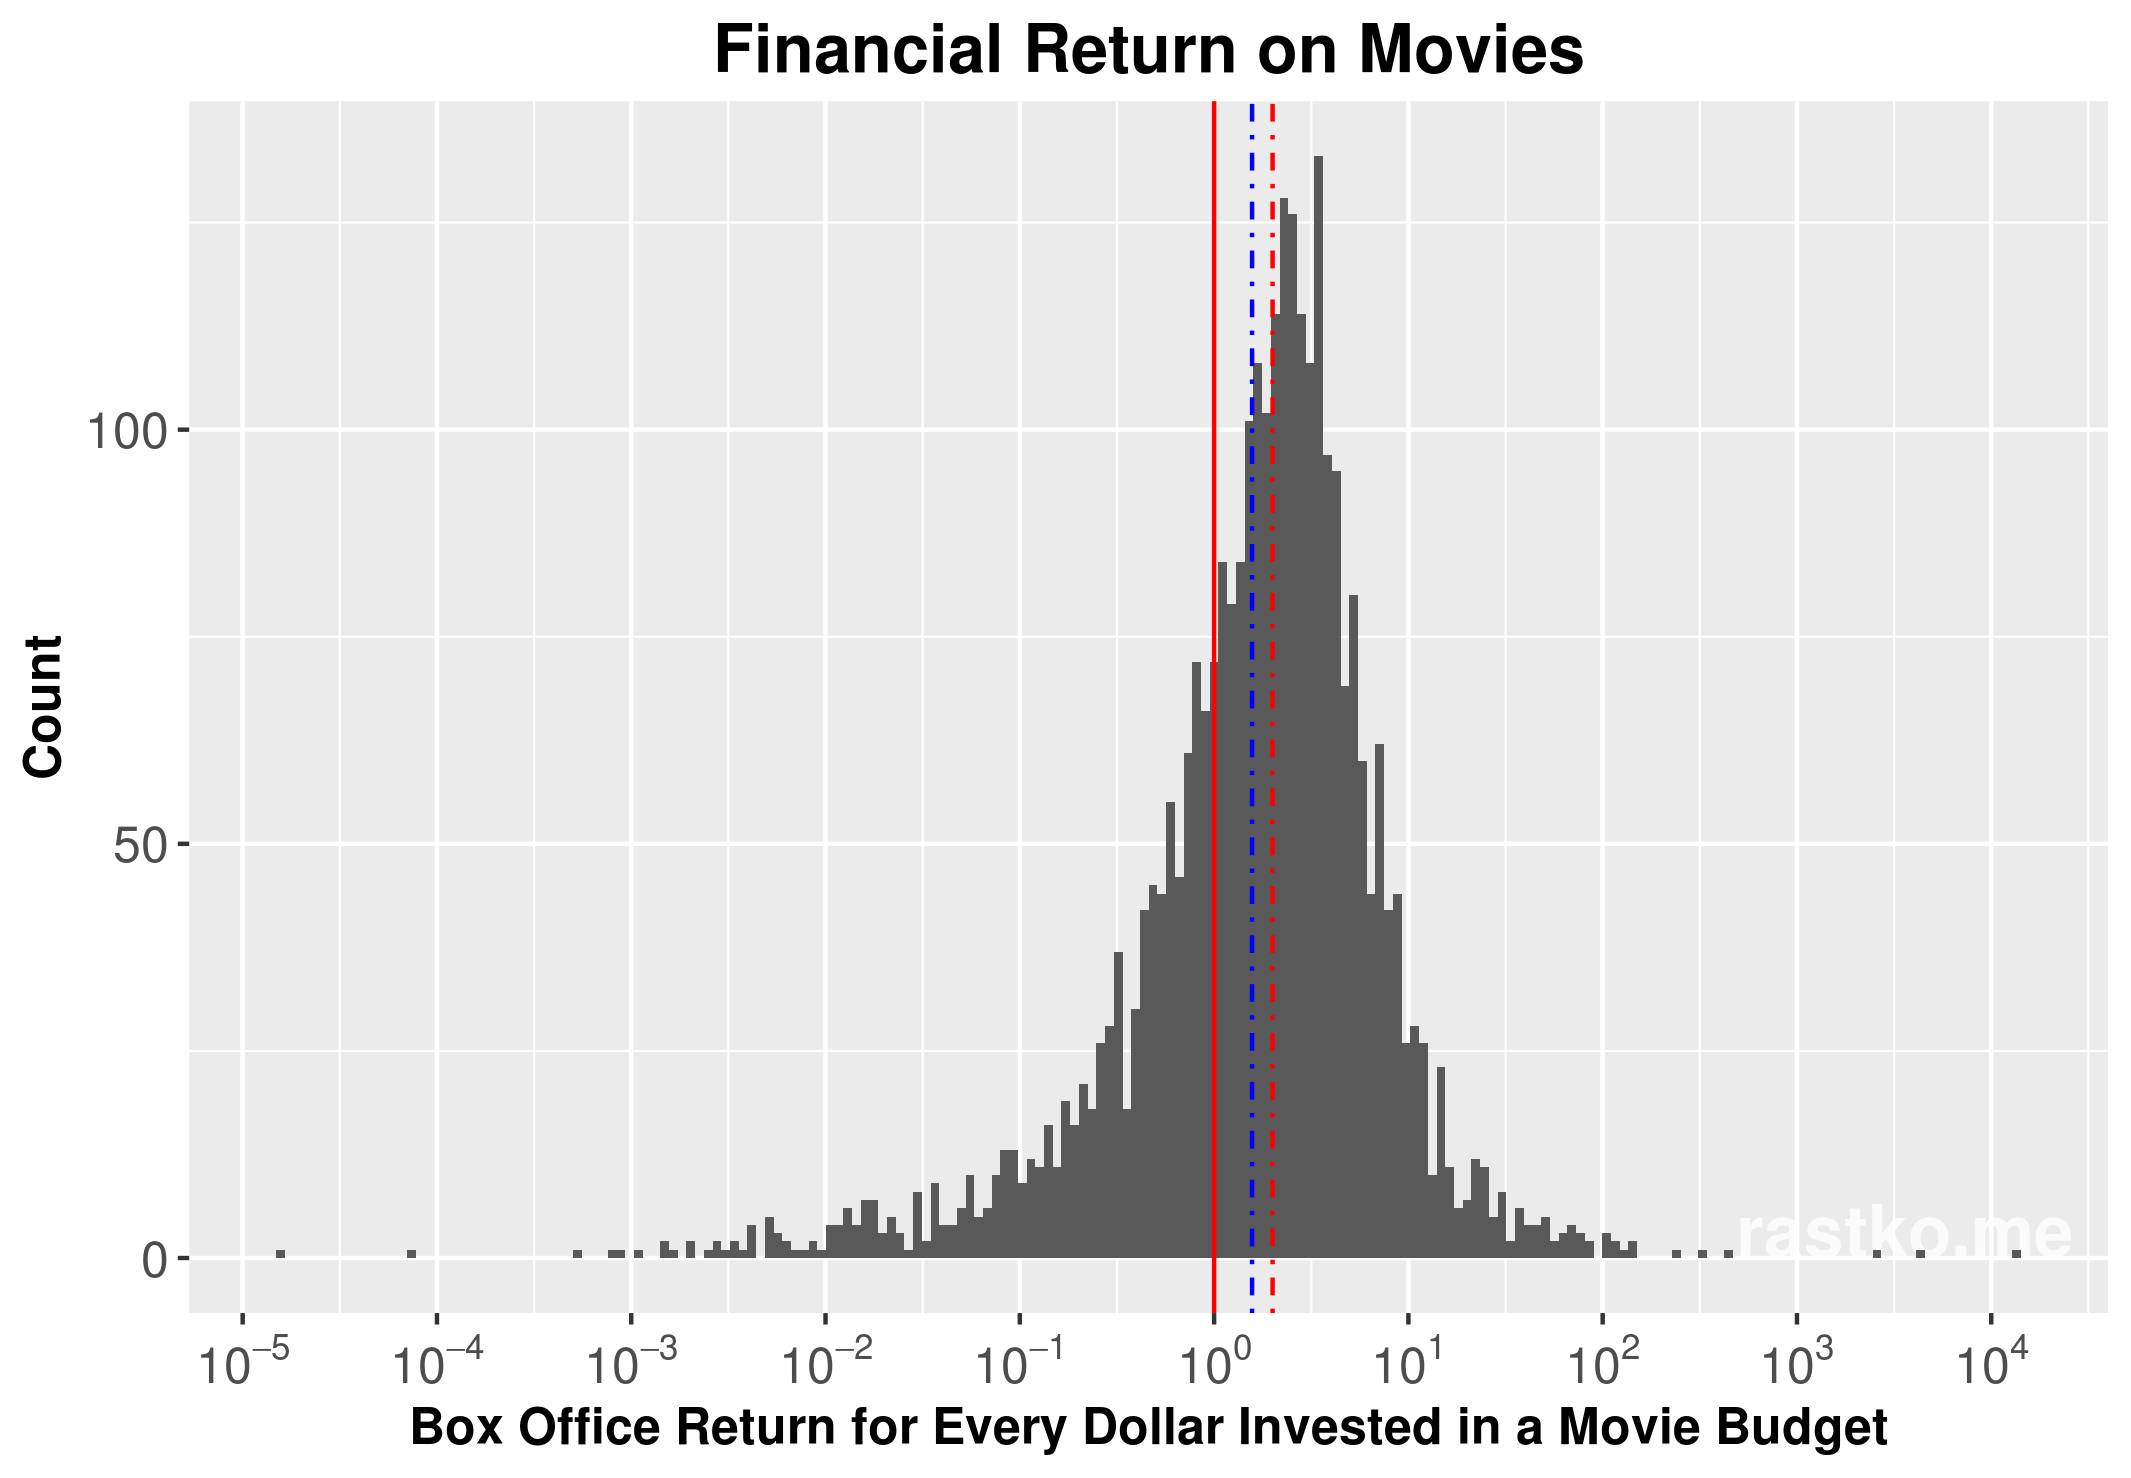
Distribution of movies' financial performance. Solid red is breakeven and dotted red is profitability line. Dotted blue line represents the mean of the data
Its quite interesting to see what the shape of the distribution looks like. There are extremes on both ends of the distribution with some movies making more than $10k for every $1 of budget, and some movies making fractions of a penny for every $1 of budget. The breakeven line (solid red) and the profitability line (dotted red) give a sense of how well of an investment a movie is. I also calculated the mean (dotted blue line) and the median. Interestingly enough, the median of the distribution is exactly 2.001 which is pretty much the same as the profitability line (median line is omitted since the two lines would overlap) and the mean is 1.57. From this we can deduce that 50% of movies are profitable and that on average, investing in movies is likely to lose money after taking into account the 50% the box office fees taken by the theater. While, on the surface, this may make it seem like a movie is a poor investment, taking into account the budget of the movie paints a different story. A production company may gamble on some number of low to mid budget movies that have a potentially high payout (such as John Wick), however, it is the high budget movies that make or break the companies bank 5.
Segmenting the movie data by budget, as we have done in our linear regression model, allows us to see how the distribution of box office returns changes with budget.
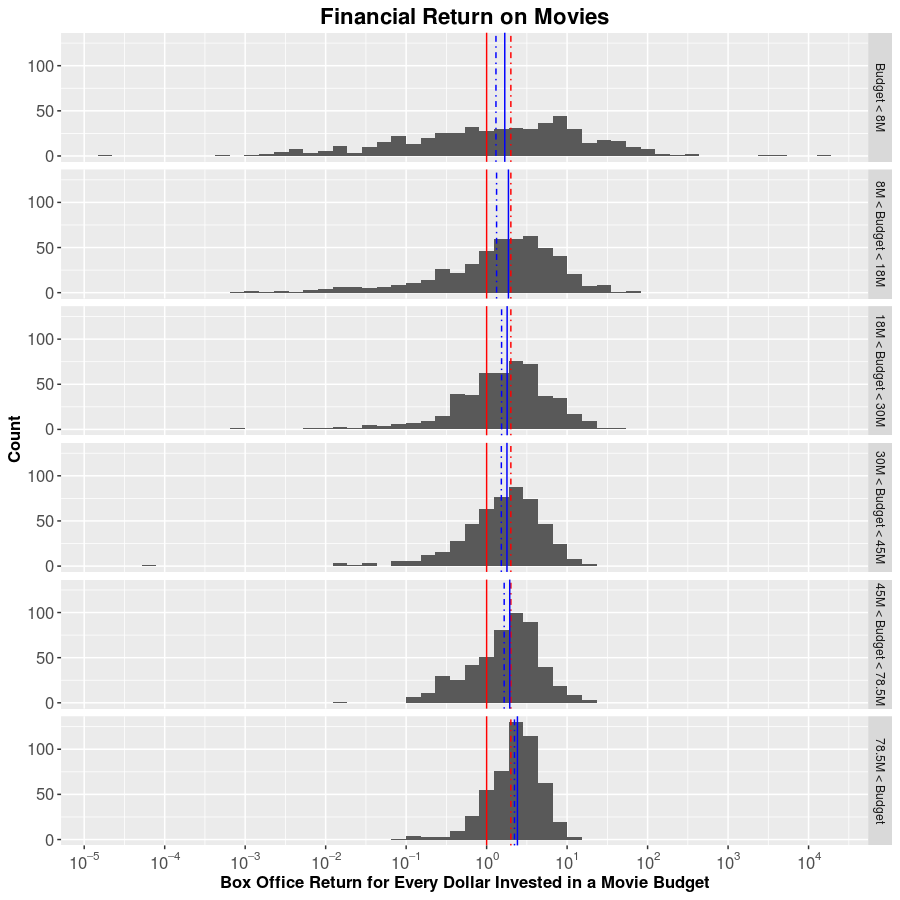
Distribution of movies' financial performance segmented by the budget of the movies. Solid red is breakeven and dotted red is profitability line. Dotted blue line represents the mean of the data and the solid blue line is the median
We can clearly see that the variance of the distribution decreases as the budget increases, a fact observed in our first linear regression graph. We also notice other interesting trends. Both the mean and the median increase as the movie budget increases and that the mean and the median seem to converge. This ties in with the idea that production companies are a lot more careful with bigger projects. The greater the budget, the more pressure there is to get a positive return on the investment and the less room for error. A loss on a $100M movie investment could be devastating for the production company, so the production company is willing to forgo a large potential return in exchange for a more certain smaller return. However, the company could absorb a couple of low budget flops which could potentially provide a large return on the investment. This is equivalent to the financial concept of risk-return tradeoff. Investment wise, The more expensive movies can be seen as blue chip companies and the less expensive movies are startups.
Conclusion
It’s interesting to see all this movie financial data laid out. My main motivating factor behind this post was to present financial returns of movies in some nice plots as I haven’t been able to find this information elsewhere on the internet. While I looked at only one metric of movie performance, I haven’t really dug deeper into the qualitative aspect of the movies that succeed and those that fail in the box office. In my next post I hope to discuss how established franchises are Hollywoods safe investment and how successful single movies get turned into franchises.
-
I am aware that Oscar nominations, which are correlated to the quality of a movie, do increase box office revenue, however its effect will not be discussed in this post. ↩
-
The topic of Hollywood accounting and movie budgeting is both interesting and complicated by itself and deserves a blog post (or a few) of its own. Here is an interesting article that describes what the corporate structure of the movie looks like to enable Hollywood accounting ↩
-
I am sure that there is some specific accounting term to define the ratio between the revenue and the cost of an investment. Unfortunately I’m not an accountant and I wasn’t able to determine this ratios proper name after 15 min googling, so I decided to call it the profitability ratio. ↩
-
The poor performance of The Golden Compass in the domestic box office is cited as the primary reasons for New Line Cinemas downfall and its acquisition by Warner Bros. ↩